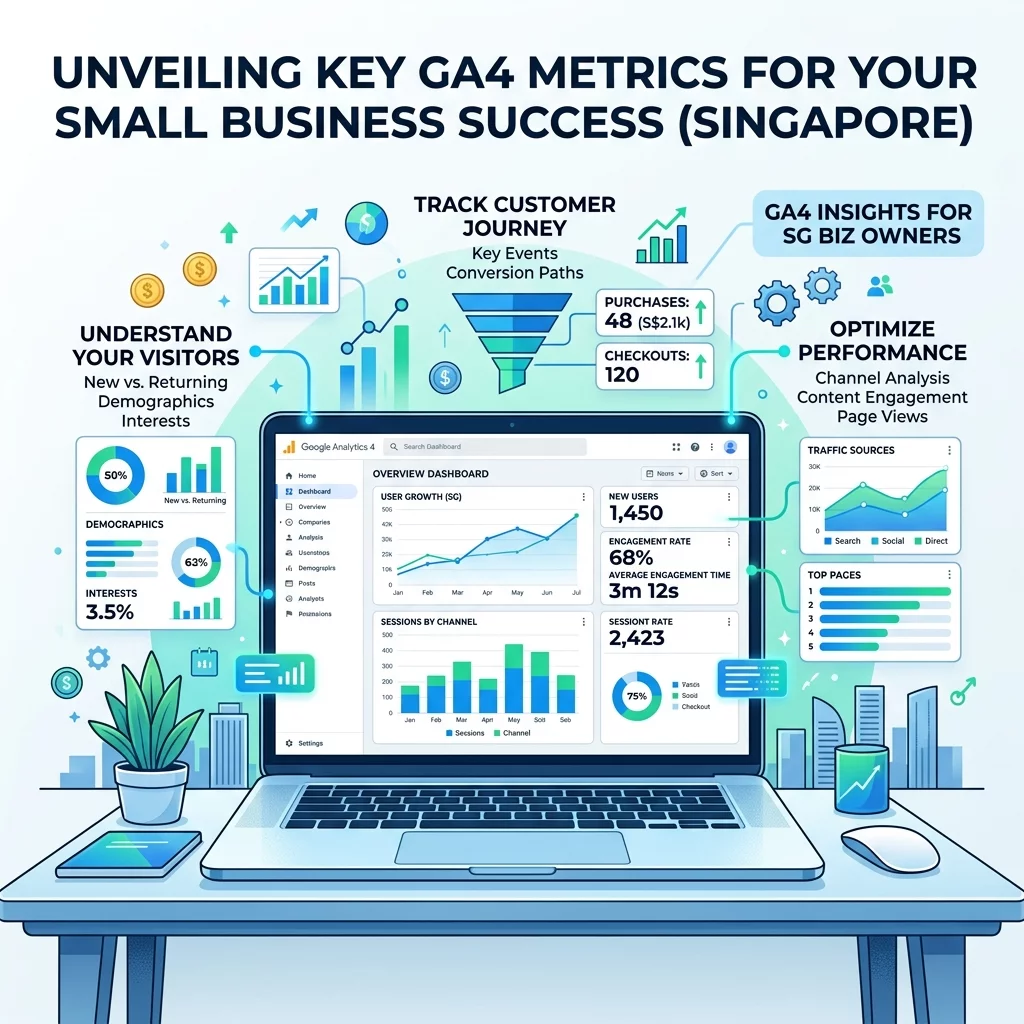
If you have been checking your website's Google Analytics and feeling confused about why bounce rate no longer works the way it used to, you are not alone. Singapore business owners who rely on Google Analytics to understand their customers are facing a fundamental shift in how web analytics works. Google Analytics 4, or GA4, has replaced the older Universal Analytics, and with it comes an entirely new way of measuring what happens when someone visits your website. The bounce rate metric that many of us have used for years is no longer a reliable indicator of whether your website is doing its job. This change matters because the decisions you make about your website, your marketing budget, and your business growth all depend on understanding what is actually happening when potential customers arrive at your site.
Understanding GA4 metrics is one of the most important skills a Singapore business owner can develop in 2026. Your website is often the first point of contact between you and a potential customer. If you cannot accurately measure what is working and what is not, you risk wasting money on marketing that does not convert, missing opportunities to improve the customer experience, and falling behind competitors who have embraced data-driven decision making. The good news is that GA4, while more complex than its predecessor, actually provides richer and more actionable data once you know what to look for. This guide will walk you through exactly which metrics you should be tracking, why the old metrics like bounce rate have become less useful, and how to set up your GA4 dashboard so you can make better decisions for your business.
Why Bounce Rate No Longer Tells the Full Story
The concept of bounce rate in Universal Analytics was straightforward: a bounce happened when someone landed on a page and then left without triggering any other request to the Google Analytics server. This meant they did not click to another page, did not submit a form, and did not trigger any events. The assumption was that a high bounce rate meant your page was not engaging or relevant to visitors. However, this definition created numerous problems that made bounce rate an unreliable metric for modern websites.
First, bounce rate treated all single-page visits the same, regardless of what the visitor actually did. If someone read your entire blog post and then left, that counted as a bounce even though they engaged deeply with your content. If someone landed on your page and immediately hit the back button because they clicked a bad search result, that also counted as a bounce. These are completely different situations, but bounce rate could not tell them apart. Second, bounce rate was calculated differently depending on how your website was built. Single-page applications and websites with heavy JavaScript often underreported bounces because the analytics code could not properly detect when someone had actually left the site. Third, bounce rate varied wildly across different industries and types of pages, making it nearly impossible to compare your bounce rate against competitors or even against your own pages from different campaigns.
GA4 addresses these problems by replacing bounce rate with more nuanced engagement metrics. Instead of simply measuring whether someone left after viewing one page, GA4 measures whether someone actually engaged with your content. This shift from measuring bounces to measuring engagement gives you a much clearer picture of whether your website is achieving its goals. The key is understanding which new metrics in GA4 actually matter for your Singapore business and how to interpret them correctly.
The Most Important GA4 Metrics for Singapore Business Owners
When you open GA4 for the first time, you will see dozens of metrics and dimensions available. It can be overwhelming, especially if you are used to the simpler Universal Analytics interface. However, for most Singapore small business owners, there are a handful of metrics that truly matter because they directly connect to business outcomes like sales, leads, and customer satisfaction. Understanding these core metrics will give you more actionable insight than tracking dozens of secondary numbers that do not affect your bottom line.
Engaged sessions is the most fundamental new metric in GA4 and the best replacement for bounce rate as an indicator of whether visitors are actually interacting with your content. An engaged session is one that lasts longer than 10 seconds, or that ends with a conversion event, or that includes two or more page views. This means GA4 is now measuring whether someone actually spent time with your content rather than just whether they clicked to another page. For a Singapore business owner, this means you can finally see how many of your visitors are genuinely interested in what you offer. If you have a high number of engaged sessions relative to total sessions, your content is resonating with visitors. If the number is low, you need to investigate whether your content is relevant, your page load times are too slow, or your visitors are not finding what they expected.
Engagement rate is simply engaged sessions divided by total sessions, expressed as a percentage. This is the metric you should track instead of bounce rate because it tells you what proportion of your visitors are actually engaging with your content. An engagement rate of 50 percent or higher generally indicates that your website is doing a good job of keeping visitors interested. However, engagement rate benchmarks vary significantly by industry and page type. A blog post might have a higher engagement rate than a contact page because visitors who read blog posts are typically further along in their research and more committed to understanding your content. Use engagement rate to compare similar pages on your own website and to track whether your engagement is improving over time, rather than comparing yourself against arbitrary industry benchmarks.
Understanding Conversion Metrics in GA4
Conversions are the actions visitors take on your website that have direct business value. For an e-commerce site in Singapore, this might be a purchase. For a service business, it might be a form submission or a phone call. For a content site, it might be a newsletter signup. GA4 allows you to track any action as a conversion, which gives you tremendous flexibility in measuring what matters most to your business. However, this flexibility also means you need to think carefully about which conversions to track and ensure you are measuring things that actually indicate a potential customer taking a meaningful step toward doing business with you.
To set up conversion tracking in GA4, you first need to identify the key actions on your website that represent meaningful customer engagement. These might include completing a purchase, submitting a contact form, signing up for a newsletter, downloading a price list, or spending more than a certain amount of time on a page. Once you have identified these actions, you need to create events in GA4 that fire whenever someone completes them. If you are using Google Tag Manager, this process is relatively straightforward. If you are not using a tag manager, you may need to work with your website developer to add the appropriate tracking code to your site. The important thing is to start with a small number of meaningful conversions rather than trying to track everything at once. Too many conversion goals can dilute your focus and make it harder to see what is truly important.
Once you have conversion tracking set up, the key metrics to monitor are conversion rate and total conversions. Conversion rate tells you what percentage of your visitors complete a desired action, while total conversions tells you the raw number of actions completed. Both metrics are important, but they answer different questions. A high conversion rate with low total conversions might indicate that your website is effective at converting the visitors it gets, but you need more traffic. A low conversion rate with high total conversions might indicate that you are getting lots of visitors but your website is not persuading them to take action. By tracking both metrics over time and segmenting them by traffic source, device type, and geographic location, you can develop a detailed understanding of where your website excels and where it needs improvement.
How to Read the GA4 Engagement Report
GA4 organizes its reports differently from Universal Analytics, and the engagement reports are where you will find most of the metrics that matter for understanding how visitors interact with your content. The Engagement Overview report provides a high-level summary of how visitors are engaging with your website, including metrics for pages viewed, events triggered, engaged sessions, and conversions. This is usually the best place to start when you want to get a quick sense of your website performance. However, do not stop at the overview. GA4 truly shines when you drill down into specific reports to understand the details behind the aggregate numbers.
The Pages and Screens report shows you which pages on your website are getting the most views and which are generating the most engagement. You can sort this report by engagement metrics like average engagement time and engaged sessions to see which pages are genuinely resonating with visitors rather than just getting lots of views. A page with many views but low engagement might be attracting the wrong audience or failing to deliver on the promise made in search results. A page with fewer views but high engagement is likely valuable content that is working well for the visitors who find it. Use this report to identify your strongest content and your weakest content, then investigate why the weakest content is underperforming.
The Events report in GA4 is significantly more powerful than the equivalent report in Universal Analytics because GA4 automatically tracks many events that previously required custom configuration. You can see how often specific interactions happen on your site, such as video views, file downloads, outbound clicks, and form submissions. By reviewing which events are most common and which conversions they precede, you can develop hypotheses about what drives visitor behavior and then test those hypotheses with experiments. For example, if you notice that visitors who watch your explainer video are much more likely to submit a contact form, you might experiment with placing the video higher on the page or making it more prominent in your design.
Using Traffic Source Data to Understand Where Your Visitors Come From
Knowing where your visitors come from is essential for understanding which marketing channels are working and which are wasting your budget. GA4 provides detailed information about traffic sources in the Acquisition reports, but the terminology is different from Universal Analytics and can be confusing at first. In GA4, traffic is categorized by source and medium, which tells you where the visitor came from and what type of link they clicked. For example, a visitor from Google Search would show up as a source of "google" and a medium of "organic," while a visitor from a newsletter would typically show up as a source of your email service provider and a medium of "email."
The most useful way to analyze traffic sources is to combine the acquisition data with your engagement and conversion metrics. Do not just look at how many visitors come from each source. Look at the quality of visitors from each source. If you get lots of visitors from social media but those visitors have low engagement rates and almost never convert, your social media strategy might need adjustment. If you get fewer visitors from search ads but those visitors have high engagement and conversion rates, you might want to increase your search advertising budget. This kind of analysis requires looking at multiple metrics together rather than optimizing for a single number.
GA4 also provides useful information about the devices and browsers your visitors use. In Singapore, mobile traffic is typically a significant portion of total website visits, so it is important to ensure your website performs well on smartphones and tablets. Use the Tech reports to see what percentage of your visitors are on mobile versus desktop, and then check your engagement and conversion rates segmented by device. If mobile visitors have significantly lower engagement or conversion rates, that is a strong signal that your website needs better mobile optimization. Common issues include slow page load times on mobile connections, buttons and links that are too small to tap easily, and content that is difficult to read on small screens.
Setting Up a Custom Dashboard for Ongoing Monitoring
GA4's built-in reports are useful for ad-hoc analysis, but the most powerful way to monitor your metrics is to create a custom dashboard that shows you the numbers that matter most for your business in a single view. This allows you to quickly check your website health without navigating through multiple reports, and it makes it easier to spot trends over time. To create a custom dashboard, click on the Library icon in the left sidebar of GA4, then navigate to Dashboards, and select Create Dashboard. You can add widgets that display specific metrics, charts that show trends over time, and tables that compare performance across different segments.
When building your dashboard, focus on including metrics that you can act on. Include your primary conversion metric, whether that is purchases, form submissions, or newsletter signups. Include engagement metrics like engaged sessions and engagement rate to understand content quality. Include traffic source data to see which channels are driving the most valuable visitors. Include at least one metric that tracks page load performance or technical health, because a slow website can silently kill your conversions even when everything else looks good. A well-designed dashboard should give you a complete picture of your website performance in under a minute, allowing you to quickly identify any issues that need attention.
Once you have your dashboard set up, check it on a regular schedule that matches your business rhythm. For most Singapore businesses, a weekly check is appropriate for ongoing monitoring, but you might want to check more frequently after launching a new marketing campaign or making significant changes to your website. The key is consistency. If you check your metrics regularly, you will develop intuition for what normal performance looks like for your business, and you will be able to spot anomalies quickly when something unusual happens.
Common Mistakes to Avoid When Reading GA4 Metrics
One of the most common mistakes Singapore business owners make with GA4 is comparing their metrics directly to industry benchmarks or to competitors without understanding the context behind those numbers. Every website is different, with different audiences, different content, different conversion goals, and different traffic sources. A bounce rate of 70 percent might be excellent for one website and terrible for another, depending on the types of pages and the visitor intent. Instead of worrying about how your numbers compare to external benchmarks, focus on tracking your own trends over time and on comparing similar pages or campaigns against each other within your own analytics.
Another common mistake is tracking too many metrics at once. GA4 provides access to a vast array of data, and it can be tempting to try to monitor everything. However, this leads to analysis paralysis where you spend so much time collecting data that you never actually act on it. Pick a small number of key metrics that directly connect to your business goals and focus on those. Once you have a solid understanding of your core metrics, you can expand your analysis to include additional dimensions. But start simple. The goal of analytics is to inform your decisions, not to create a full-time job as a data analyst.
Finally, be careful about drawing conclusions from data without considering the context. A sudden spike or drop in any metric usually has an explanation, and you need to understand that explanation before you can respond appropriately. Possible causes include seasonal fluctuations in your business, changes to your marketing campaigns, technical issues with your website, changes in search engine algorithms, and broader economic or social trends that affect consumer behavior. When you see something unusual in your data, investigate. Check your website for technical issues, review your recent marketing activities, and consider whether external factors might be at play. Data without context is just noise, and the goal of analytics is to extract signal from that noise.
If you still need help, feel free to contact us at https://webcare.sg/contact for a free website health check.