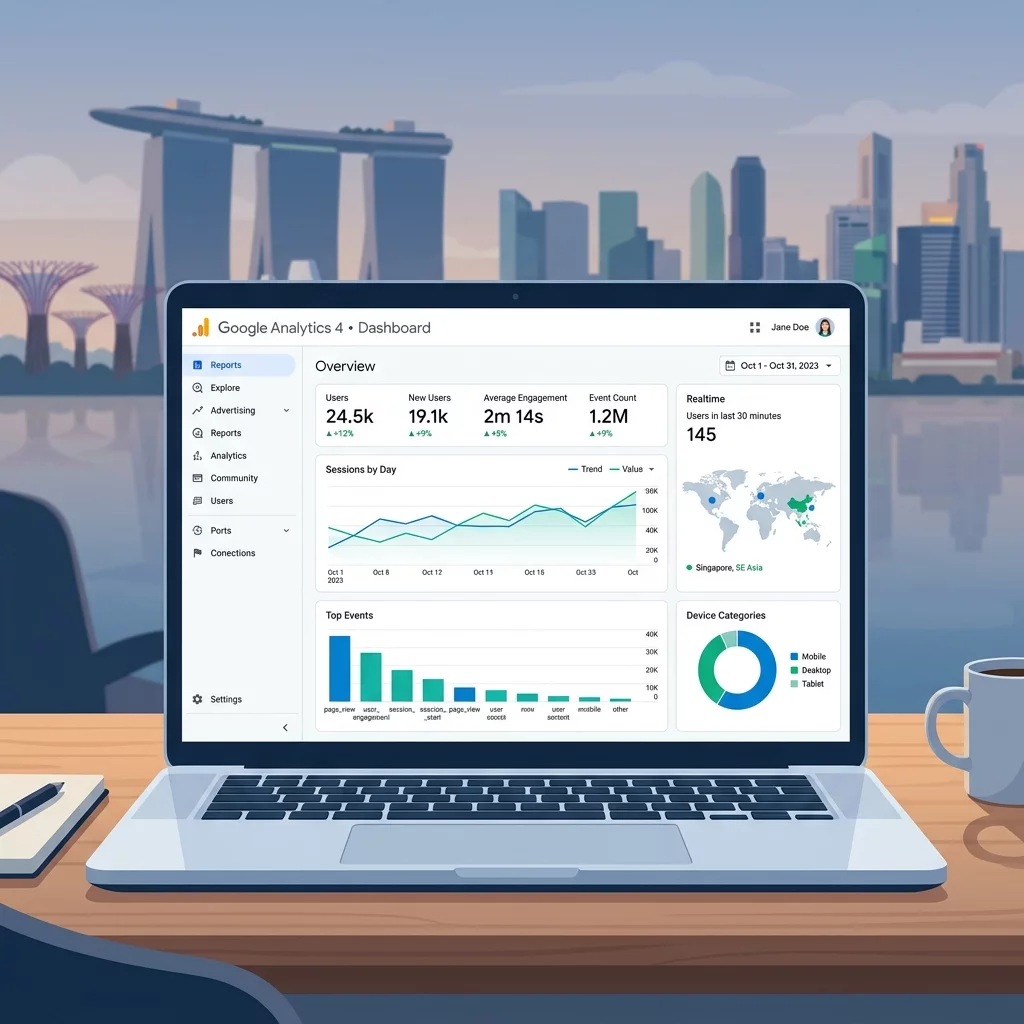
If you run a business website in Singapore, you need to understand what's happening on your site. Who visits? What do they click? Where do they come from? Without this information, you're essentially flying blind, spending money on marketing without knowing what actually works. Google Analytics 4 (GA4) is the latest version of Google's free web analytics tool, and it gives Singapore business owners powerful insights into their website visitors and their behavior. This guide will walk you through setting up GA4, tracking the events that matter to your business, understanding conversions, and reading reports - all without needing any technical background.
Many Singapore business owners still use the older Universal Analytics (UA) or have never set up any analytics at all. If you fall into either category, you're missing out on crucial data that could help you make better business decisions, spend your marketing budget more wisely, and ultimately get more customers through your website. The good news is that setting up GA4 is completely free, and with a little guidance, you can have it working on your website today. Let's get started.
What is Google Analytics 4 and Why Does It Matter for Your Singapore Business?
Google Analytics 4 (GA4) is the newest version of Google Analytics, launched in 2020 and now the default version for all new accounts. Unlike its predecessor, GA4 uses an event-based data model, which means everything that happens on your website - page views, button clicks, form submissions, purchases - is treated as an event. This gives you much more flexibility in tracking specific actions that matter to your business.
For a Singapore business owner, GA4 helps you answer questions like: How many people visited my website this month? Where are my visitors coming from - Google search, Facebook, direct traffic? Which pages do people spend the most time on? Are visitors completing the actions I want them to take, like filling out my contact form or buying my product? What devices are my visitors using - desktop or mobile? Which marketing campaigns are bringing me the most valuable customers?
Without answers to these questions, you're essentially guessing about your website's performance. GA4 takes the guesswork out of understanding your website visitors and helps you make data-driven decisions that can improve your return on investment (ROI) for all your marketing activities.
Step 1: Creating Your Google Analytics 4 Property
Before you can track anything, you need to create a GA4 property. Here's how to do it step by step:
- Go to the Google Analytics website at analytics.google.com and sign in with your Google account. If you don't have a Google account, you'll need to create one first. Use an email address that you check regularly, as Google will send important notifications to this email.
- Once you're signed in, click the "Admin" gear icon in the bottom left corner of the screen. This is where you manage all your Analytics settings.
- In the Admin panel, you'll see three columns: Account, Property, and View. In the Property column, click the dropdown that says "Universal Analytics" and select "Create only Google Analytics 4 property". This will create a new GA4 property alongside your existing Universal Analytics if you have one.
- You'll be asked to enter your website details. For Property name, enter something recognizable like your business name followed by "Website" - for example, "ABC Bakery Website" or "SingTech Solutions Main Site."
- Select your Reporting time zone. If your business is based in Singapore, select "Singapore" from the dropdown. This ensures your data aligns with Singapore Standard Time, which makes reports easier to understand.
- For Currency, select "Singapore Dollar (SGD)" if you want all your e-commerce and conversion values shown in local currency. This is important if you're tracking purchases or revenue on your site.
- Click "Next" to continue. You'll be asked about your business category - select the option that best describes your business. This helps Google provide industry-specific insights.
- On the next screen, you can choose whether to share your data with Google to help improve Google products. You can skip this or accept it depending on your preference. Click "Create" to finish setting up your property.
Congratulations! You've created your GA4 property. Now you need to install the tracking code on your website to start collecting data.
Step 2: Installing the GA4 Tracking Code on Your Website
The tracking code (called "gtag.js") is a small piece of JavaScript that you need to add to every page of your website. When someone visits your site, this code sends information to Google Analytics about their activity. Here's how to get it set up:
If you use WordPress:
- Log in to your WordPress dashboard (usually at yourdomain.com/wp-admin).
- Navigate to Plugins > Add New on the left sidebar.
- Search for "SiteKit by Google" in the search bar and install the plugin.
- Once installed, activate the plugin and follow the setup wizard. You'll need to sign in with your Google account and give permission for the plugin to access your Analytics data.
- The plugin will automatically add the tracking code to all your pages. You don't need to touch any code yourself.
If you use Wix, Shopify, or other website builders:
- Log in to your website builder's admin panel.
- Look for settings related to "Marketing" or "Analytics" - the exact location varies by platform.
- Find the option to add Google Analytics and paste your GA4 Measurement ID (which you'll get from the next step).
- Save your changes. The tracking code will be added automatically.
If you use a custom-built website or work with a web developer:
- Copy your GA4 Measurement ID from the setup screen. It looks like "G-XXXXXXXXXX" or "AW-XXXXXXXXXX."
- Give this ID to your web developer and ask them to add it to every page of your website, ideally in the head section before the closing tag.
- Alternatively, if you have access to edit your website's code, paste the gtag.js code directly. You'll find this code snippet in your GA4 Admin panel under "Data Streams" and then your web stream.
Step 3: Understanding Events in Google Analytics 4
As mentioned earlier, GA4 treats everything as an event. Understanding events is key to getting value from your analytics. In GA4, there are several types of events you should know about:
Automatically collected events - These are events that GA4 collects automatically without any extra setup. They include:
- first_visit - When someone first visits your website
- session_start - When someone starts a new browsing session
- user_engagement - Periodically fired to indicate active engagement
- page_view - Every time someone views a page on your site
Enhanced measurement events - These are optional events you can enable that automatically track common user interactions. To enable enhanced measurement:
- Go to your GA4 Admin panel and click "Data Streams" under the Property column.
- Click on your web stream (usually your main website).
- Scroll down to "Enhanced measurement" and toggle it on.
- Check the boxes for the events you want to track automatically: Outbound clicks (when someone clicks a link to an external site), Site search (when someone uses a search function on your site), Video engagement (when someone watches videos on your site), and File downloads (when someone downloads a file like a PDF).
Custom events - These are events you create to track specific actions important to your business. For example, you might want to track when someone clicks a "Call Now" button on mobile, submits a quote request form, or watches more than 50% of a product demo video. Creating custom events requires a bit more setup, which we'll cover next.
Step 4: Setting Up Conversions to Track Business Goals
Conversions are the most important events to track because they represent actions that have actual business value - like a customer purchasing a product, signing up for a newsletter, or submitting a contact form. Here's how to mark events as conversions:
- Go to your GA4 Admin panel and click "Events" under the Property column.
- You'll see a list of all events that have been recorded on your site. Events marked with a star icon are already set as conversions. Click on any event to see its details.
- To mark an event as a conversion, check the box next to the event name and click "Mark as conversion" at the top of the screen. The event will now appear in your Conversion reports.
Common conversions for Singapore business websites include:
- Contact form submissions - Track when visitors fill out your contact form and submit it.
- Phone calls - If you have a click-to-call button, track when mobile users tap it to call your business.
- Quote requests - For service businesses, track when someone requests a quote.
- Newsletter signups - Track email subscription form submissions.
- Purchases - For e-commerce sites, track completed transactions.
- WhatsApp messages - Many Singapore businesses use WhatsApp for inquiries - track when visitors click your WhatsApp link.
To track custom events like phone calls or WhatsApp clicks, you'll need to work with your developer or use Google Tag Manager. However, the GA4 Setup Assistant in your Analytics account can often import events from your existing Universal Analytics setup if you're migrating.
Step 5: Reading the Key Reports in GA4
Now that you have GA4 installed and you're collecting data, let's look at the most important reports for Singapore business owners:
Realtime Report
Go to Reports > Realtime to see who's on your website right now. You can see how many people are currently browsing, which pages they're viewing, where they're located (including Singapore), and what devices they're using. This report is useful for verifying that your tracking is working correctly - you should see yourself appear here if you're testing your own website.
Traffic Acquisition Report
Go to Reports > Acquisition > Traffic acquisition to see where your website visitors come from. This report shows you the breakdown between:
- Organic Search - Visitors who found you through Google or other search engines
- Direct - Visitors who typed your URL directly or came from bookmarks
- Referral - Visitors who came from links on other websites
- Social - Visitors who came from Facebook, Instagram, LinkedIn, and other social media platforms
- Paid Search - Visitors who clicked your ads in Google search results
For a Singapore business, understanding this breakdown helps you allocate your marketing budget wisely. If most of your traffic comes from organic search, you should invest in SEO. If social media brings you the most visitors, focus more effort on your social media presence.
Engagement Report
Go to Reports > Engagement to see how visitors interact with your site. Key sub-reports include:
- Pages and screens - Shows which pages get the most views. Look for your most visited pages and understand what makes them successful.
- Conversions - See how many times your key conversion events have occurred. You can see trends over time and identify which traffic sources bring the most conversions.
- Events - Detailed breakdown of all event types on your site.
Demographics Report
Go to Reports > User > User attributes to see information about your users including:
- Location - What countries and cities your visitors come from. For local Singapore businesses, you'll likely see Singapore as your top location, followed by other Southeast Asian countries.
- Age and Gender - Demographic information about your audience. This helps you understand if your marketing is reaching the right demographic.
- Interests - What categories of content and products your users are interested in based on their browsing behavior.
Tech Report
Go to Reports > Technical to understand what devices and browsers your visitors use. This is crucial for making design decisions. If 60% of your visitors are on mobile phones, you need to ensure your website is mobile-friendly. If most visitors use Chrome, make sure your site looks good in Chrome.
Step 6: Setting Up Dashboards for Quick Insights
GA4 allows you to create custom dashboards that put your most important metrics in one place. Here's how to set one up:
- In GA4, click "Library" in the left sidebar (under Reports).
- Click "Create new dashboard" and give it a name like "My Business Overview."
- Choose between creating a "Detail dashboard" (more customizable) or using a "Explorer dashboard" (includes AI-powered insights).
- Add widgets for the metrics you care about most - like total visitors, conversion rate, traffic by source, and top pages.
- Set the date range and save your dashboard.
You can create multiple dashboards for different purposes - one for overall performance, one for marketing campaign tracking, and one for e-commerce metrics if you sell products online.
Step 7: Connecting GA4 to Other Google Tools
For Singapore businesses, connecting GA4 to other Google tools can provide additional insights:
Google Search Console
Search Console shows you how your website appears in Google search results and which search queries bring people to your site. To connect it:
- Go to GA4 Admin > Data imports > Search Console.
- Click "Link" and select your Search Console property.
- You can now see search query data directly in your GA4 reports.
Google Ads
If you run Google Ads campaigns for your Singapore business, connecting GA4 to Google Ads lets you see which ads actually lead to valuable actions on your website:
- Go to GA4 Admin > Account links > Google Ads.
- Click "Link" and select the Google Ads accounts you want to connect.
- Enable remarketing and conversion tracking options as needed.
Common GA4 Mistakes to Avoid
Many Singapore business owners make these common mistakes when using GA4:
Not setting up conversions - If you don't mark your important events as conversions, you won't see them in your conversion reports. Make sure to identify your key business goals and mark those events as conversions.
Ignoring data sampling - When you have a lot of data, GA4 may use sampling (analyzing a portion of your data rather than all of it) for certain reports. This can lead to inaccurate results. If you need full data accuracy, use unsampled reports in the Explore section or connect GA4 to BigQuery for complete data analysis.
Not checking for data gaps - Sometimes tracking code can fail to load, resulting in missing data. Regularly compare your GA4 numbers with other data sources (like your CRM or sales records) to ensure accuracy.
Focusing on vanity metrics - Page views and session duration are interesting but not directly tied to business outcomes. Focus on conversion metrics - how many people completed your important actions - rather than just traffic volume.
Not using annotations - When you make significant changes to your website or launch marketing campaigns, add annotations in GA4 to mark these events. This helps you understand why metrics changed over time rather than guessing at the cause.
How Long Before You See Data in GA4?
After installing the tracking code, you should start seeing data in your Realtime report almost immediately. However, for more comprehensive reports, you typically need to wait 24-48 hours for data to be processed. Some reports, especially those involving user journeys and attribution, may take up to 72 hours to show accurate data.
For meaningful trend analysis, you generally need at least 7-14 days of data. For seasonal businesses in Singapore - like those in the food and beverage industry that see spikes during Chinese New Year or other holidays - you may need several weeks or months of data to understand patterns and make meaningful comparisons.
Understanding GA4 Reports Terminology
GA4 introduces some new terminology that may be confusing if you're used to Universal Analytics:
- Sessions vs. Engaged sessions - A session is a group of interactions one user has with your website within a given time period. An engaged session is one that lasts longer than 10 seconds, has a conversion event, or has at least one page view. Engaged sessions are generally a better metric for quality traffic.
- Bounce rate vs. Engagement rate - In GA4, bounce rate (percentage of single-page sessions) is replaced by engagement rate (percentage of engaged sessions). A higher engagement rate is better, showing that more visitors are interacting meaningfully with your site.
- Users vs. Active users - GA4 distinguishes between new users (first-time visitors), returning users, and active users (those who have engaged recently). Active users is generally the most useful metric.
- Source/Medium vs. Session default channel grouping - GA4 groups traffic into channels (like Organic Search, Direct, Social) rather than just showing raw source and medium. This makes reports easier to interpret.
Making Data-Driven Decisions for Your Singapore Business
The real value of GA4 isn't in the numbers themselves - it's in using those numbers to make better business decisions. Here are practical ways Singapore business owners can use GA4 data:
Improve your marketing budget allocation - If you find that social media traffic converts better than paid search traffic, you might shift more budget to social media marketing. GA4 shows you which channels deliver the best results, not just the most traffic.
Optimize your website content - If you see that certain blog posts or product pages get a lot of traffic but low engagement, consider improving that content or making the calls-to-action clearer. GA4 helps you identify both successes and opportunities for improvement.
Understand your mobile users - Many Singaporeans browse on their phones. If you see high mobile traffic but low mobile conversions, your site may have mobile usability issues that need fixing.
Track campaign performance - When you run a promotion or marketing campaign, use UTM parameters (which you can add to your campaign URLs) to track exactly how many visitors and conversions came from each campaign. GA4 will show you which campaigns bring the best results.
Identify seasonal patterns - Over time, you'll see seasonal trends in your data. Singapore has unique seasonality around holidays like Chinese New Year, Hari Raya, Deepavali, and Christmas. Understanding these patterns helps you plan your marketing and inventory.
Next Steps: Diving Deeper into GA4
This guide covers the essentials of GA4 setup and reporting, but there's much more you can learn to get even more value from your analytics:
- Google Tag Manager - This free tool from Google gives you more control over tracking codes and events on your site without needing to edit your website's core code. It's especially useful for tracking complex user journeys and setting up conversion tracking for forms, buttons, and other interactive elements.
- Advanced segments - Create custom segments to analyze specific groups of users - for example, visitors from Singapore only, mobile users, or users who visited a specific page. Segments let you compare different user groups and understand their behavior patterns.
- Audience definitions - Build audiences based on user behavior - for example, "users who made a purchase" or "users who visited more than 3 pages." You can then target these audiences with Google Ads remarketing campaigns.
- Exploration reports - The Explore section in GA4 provides advanced analysis tools including funnel exploration, path exploration, and segment overlap analysis. These tools help you understand exactly how users move through your website.
Setting up Google Analytics 4 properly takes some initial effort, but it's one of the best investments you can make for your Singapore business website. The insights you gain will help you understand your customers better, improve your marketing ROI, and ultimately grow your business online. Start with the basics outlined in this guide, and gradually explore more advanced features as you become more comfortable with the platform.
If you still need help, feel free to contact us at https://webcare.sg/contact for a free website health check.